BEBPA Blog
Tech Briefing: Dealing with the Intricacies of Potency Assay Dose-Response Curves
Potency bioassays are typically relative assays, meaning that the full dose-response curve of the reference is compared to the full dose-response curve of the test material. This is usually done in a stepwise fashion.
- The data is often transformed, meaning that the concentration of the dose (or the dilution) is logged.
- Then the dose-response curves are modeled. Usual models include straight lines (a 2-parameter curve) and a logistic fit (a 4-parameter fit).
- Each sample, the reference and the test, is fit with the best-fit model.
- These two models are compared and if determined to be similar, are then fit with consensus model parameters for all parameters except ED50.
- The two-consensus, dose-response curves, one for the reference and one for the test sample, are then compared. A shift right or left indicates a difference in potency between the two samples.
- The potency is calculated with a ratio of the ED50 of the two consensus curves.
Although this sounds complicated, modern software makes this a straightforward process as most of the above steps are automated. However, problems can occur if the analysis template is not set up appropriately or if the dose-response curves do not have the required characteristics of the models readily available on your software package.
Example Issue:
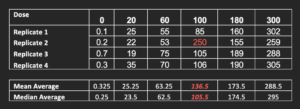
When estimating the response at a specific drug concentration, how is this done? The most common approach is to take the mean average of the replicates. However, is this appropriate? Consider the below data:

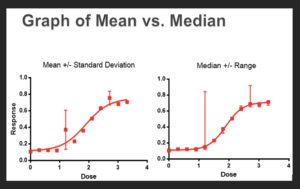
A quick look at these data suggests that the value in red (250) is an outlier. We do replicates specifically to allow us detect outliers and reduce their impact on the data set. However, if we chose to plot the underlying mean average in our analysis template, rather than the median, we get the following graphs:

There are many approaches to reducing the impact of an outlier value, one is to assess for outliers in the underlying data set utilizing one of the many available statistical methods for detecting outliers. Another is to use an estimator, such as the median which is more robust against the impact of an outlier, or yet another approach is to simply plot all the replicates without first using an estimator such as the mean or median. Fortunately, our modern software typically has all these tools available.
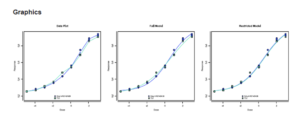
Another common issue, especially with cell and gene therapy products, is the partial dose-response curve. We often find that the data fits a logistic 4-parameter model extremely well, however, the assessment of similarity fails using our modern software. An example of this is shown below:

Even though the two curves, light blue and dark blue, appear to be nearly identical, these curves will fail similarity in many commercial potency assay software. The problem is that, since the upper asymptote is not well defined, the algorithm for the model fit assigns a wide uncertainty with the asymptote estimate. This uncertainty causes the failure rather than a lack of similarity. A simple approach to addressing this problem is to utilize point estimates of the upper asymptote rather than confidence intervals of the estimates. In the case below, the following data is found for the similarity:
![]()
It is notable here that the ratio of the test/reference asymptote is 1.067, well within a typical equivalence margin. It is only the confidence limit approach which causes the rejection.
This is just a small sample of the pitfalls one can run across when selecting the appropriate data analysis for potency assays. If you are interested in hearing about the problems and solutions that your colleagues have found during development be sure to join us at the upcoming BEBPA US BioAssay conference happening in Long Beach, CA March 11-13, 2024. At this conference, we have an Interest Group session on this specific topic:
Interest Group 3: Handling Dose-Response Curves
Ralf Stegmann, CEO, Stegmann Systems
Replicates: Should They be Averaged Before Modelling?
Matthew Stephenson, Director of Statistics, Quantics Biostatistics
Alena Nikolskaya, Associate Director, Abzena
These are just a few of the great topics and talks planned for the upcoming BEBPA Bioassay Conference happening March 11-13 in Long Beach, CA. See for yourself the great agenda and scientists giving talks. Confirmed speakers include industry and regulatory experts from: FDA, Amgen, Sanofi, Ultragenyx, Autolus Therapeutics, Tanvex, Sun Pharmaceuticals, Bristol Myers Squibb, NIST, Imugene, and Allakos. Many others are attending and sharing their experiences.
These conferences do sell out, so please sign up today and join us. If traveling is not in your budget, the main podium talks will be available to attendees joining us virtually.


